


Generally, the overhead of the Java debugger is minimal. However, it can still incur significant runtime costs under certain circumstances. In an especially unlucky setting, the debugger can even completely freeze the VM.
Let's examine the reasons behind these issues and their possible solutions.
Note: I'm using IntelliJ IDEA. The specifics outlined in this article might vary in other IDEs, and some of the mentioned features might not be available there. Nevertheless, the general troubleshooting strategy should still apply.
Diagnose the cause
Before exploring the solutions, it's wise to identify the problem. The most common reasons for the debugger slowing down the application include:
Method breakpoints
Evaluating expressions too frequently
Evaluating expressions that are computationally too heavy
Remote debugging with high latency
IntelliJ IDEA eliminates the guesswork in this step by providing detailed statistics under the debugger's Overhead tab:
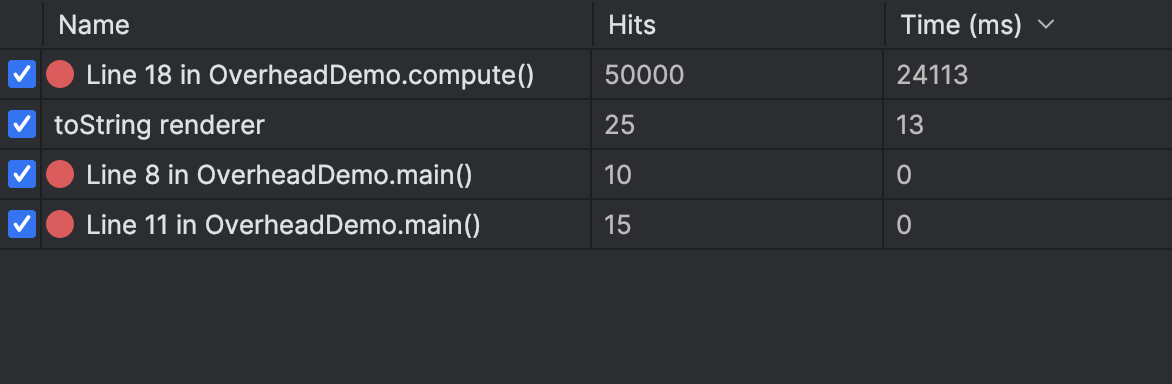
To access it, select Overhead from the Layout Settings tab. It will show the list of breakpoints and debugger features. Against each breakpoint or feature, you will see how many times it was used and the amount of time it took to execute.
Tip: If you decide to temporarily turn a resource consuming feature off, you can do that by clearing the corresponding checkbox in the Overhead tab.
Once we've identified the source of the slowness, let's look at the most common causes and how to address them.
Method breakpoints
When using method breakpoints in Java, you might experience performance drops, depending on the debugger you're using. This is because the corresponding feature provided by the Java Debug Interface is notably slow.
For this reason, IntelliJ IDEA offers emulated method breakpoints. They work just like actual method breakpoints, but much faster. This feature involves a trick under the hood: instead of setting actual method breakpoints, the IDE replaces them with regular line breakpoints within all the method's implementations across the project.
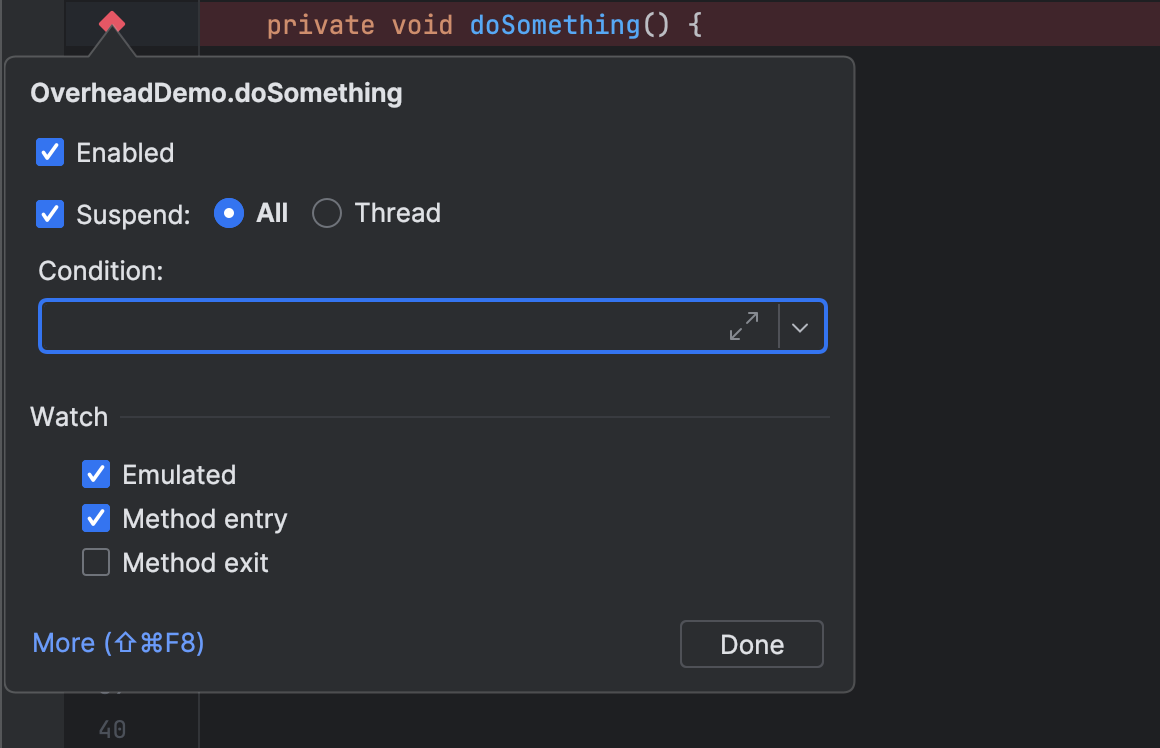
By default, all method breakpoints in IntelliJ IDEA are emulated:
If you are using a debugger that doesn't have this feature, and you encounter performance problems with method breakpoints, you can do the same trick manually. Visiting all the method implementations might be tedious, but it may also save you time while debugging.
Conditional breakpoints in hot code
Setting a conditional breakpoint in hot code might drastically slow down a debugging session, depending on how often this code is executed.
Consider the following illustration:
Java:
public class Loop {

    public static final int ITERATIONS = 100_000;

    public static void main(String[] args) {
        var start = System.currentTimeMillis();
        var sum = 0;
        for (int i = 0; i < ITERATIONS; i++) {
            sum += i;
        }
        var end = System.currentTimeMillis();
        System.out.println(sum);
        System.out.printf("The loop took: %d ms\n", end - start);
    }
}
Kotlin:
const val ITERATIONS = 100_000

fun main() = measureTimeMillis {
    var sum = 0
    for (i in 0 until ITERATIONS) {
        sum += i
    }
    println(sum)
}.let { println("The loop took: $it ms") }
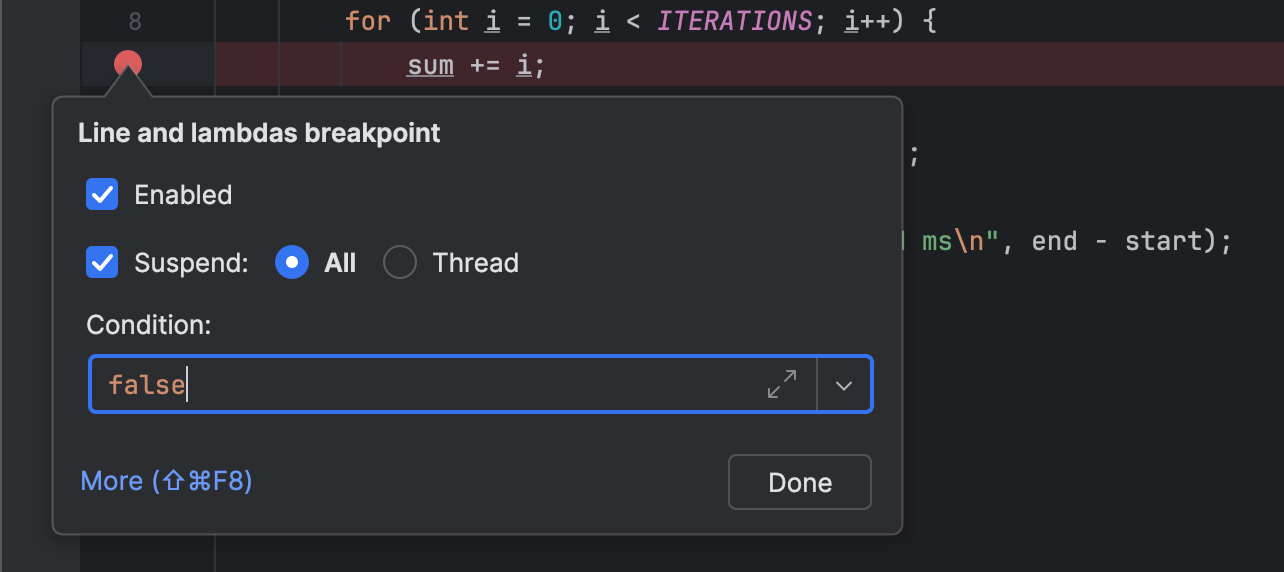
Let's set a breakpoint at sum += i and specify false as the condition. This will effectively mean that the debugger should never stop at this breakpoint. Still, every time this line runs, the debugger would have to evaluate false.
In my case, the results of running this code with and without the breakpoint were 39 ms and 29855 ms respectively. Remarkably, even with as few as 100 thousand iterations, the difference is still huge!
It may seem surprising that evaluating a seemingly trivial condition like false takes up so much time. This is because the elapsed time is not only due to the calculation of the expression's result. It also involves handling debugger events and communicating with the debugger front-end.
The solution is straightforward. You can integrate the condition directly into the application code:
Java:
public class Loop {

    public static final int ITERATIONS = 100_000;

    public static void main(String[] args) {
        var start = System.currentTimeMillis();
        var sum = 0;
        for (int i = 0; i < ITERATIONS; i++) {
            if (false) { // condition goes here
                System.out.println("break") // breakpoint goes here
            }
            sum += i;
        }
        var end = System.currentTimeMillis();
        System.out.println(sum);
        System.out.printf("The loop took: %d ms\n", end - start);
    }
}
Kotlin:
fun main() = measureTimeMillis {
    var sum = 0
    for (i in 0 until ITERATIONS) {
        if (false) { // condition goes here
            println("break") // breakpoint goes here
        }
        sum += i
    }
    println(sum)
}.let { println("The loop took: $it ms") }
With this setup, the VM will directly execute the code of the condition, and might even optimize it. The debugger, conversely, will only come into play upon hitting the breakpoint. While not required in most cases, this change can save you time when you need to conditionally suspend the program in the middle of a hot path.
The described technique works perfectly with classes with available source code. However, with compiled code, such as libraries, the trick might be harder to pull off. This is a special use-case, which I will cover in a separate discussion.
Implicit evaluation
In addition to the features where you specify expressions yourself, such as breakpoint conditions and watches, there are also features that implicitly evaluate expressions for you.
Here's an example:
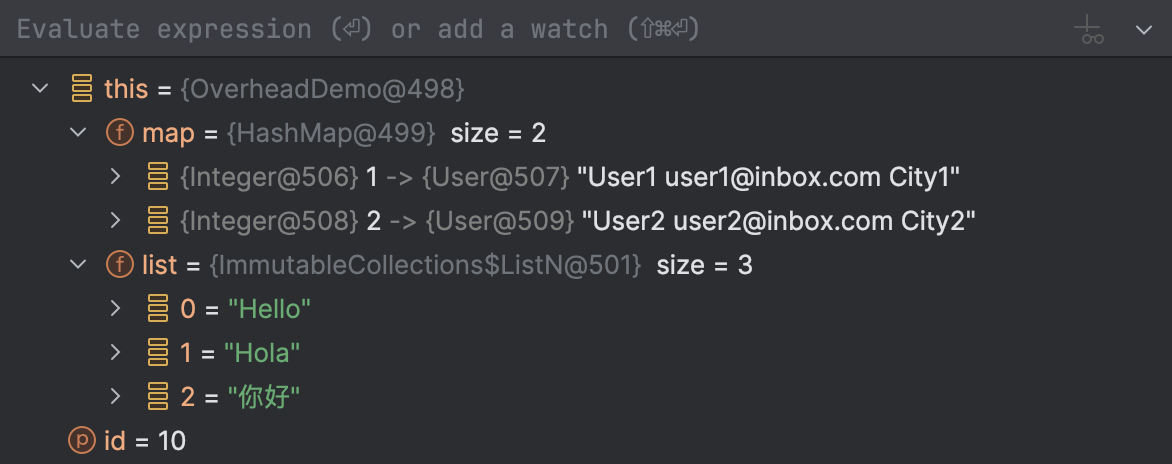
Whenever you suspend a program, the debugger displays the values of the variables that are available in the current context. Some types might have complex structures that are difficult to view and navigate. For your convenience, the debugger transforms them using special expressions, called renderers.
Renderers can be trivial like toString() or more complex, such as those that transform the content of collections. They can either be built-in or custom.
Tip: IntelliJ IDEA's debugger is very flexible in how it displays your data. It even allows you to specify renderer configuration through annotations for providing consistent class representations when multiple contributors are working on the same project. To learn more about configuring the format for displaying data, refer to IntelliJ IDEA's documentation.
Typically, the overhead brought by debug renderers is negligible, but the impact ultimately depends on the particular use-case.
Indeed, if some of your toString() implementations contains code for mining crypto, the debugger will have a hard time showing the toString() value for that class!
If rendering a certain class proves to be slow, you can turn the corresponding renderer off. As a more flexible alternative, you can make the renderer on-demand. On-demand renderers will only execute when you explicitly request to show their result.
High latency in remote debug sessions
From a technical standpoint, debugging a remote application is no different from a local debugging session. Either way, the connection is established via a socket – we're excluding the shared memory mode from this discussion – and the debugger isn't even aware of where the host JVM runs.
However, one factor that might be distinguishing for remote debugging is network latency. Certain debugger features perform several network round-trips each time they are used. Combined with high latency, this can lead to a considerable performance degradation.
If that is the case, think about running the project locally, as it could be a time-saver. Otherwise, you might benefit from temporarily turning off some of the advanced features.
Conclusion
In this article, we've learned how to fix the most common issues causing debugger slowness. While sometimes the IDE will take care of that for you, I believe it's important to understand the underlying mechanisms. This makes you more flexible, efficient, and creative in your day-to-day debugging.
I hope you found these tips and tricks useful. As always, your feedback is greatly appreciated!
To get updated about new tips and tricks, subscribe to me on X, or you can use RSS or the mailing list on my blog.
Happy debugging!