


There are a lot of debugger tutorials out there that teach you how to set line breakpoints, log values, or evaluate expressions. While this knowledge alone gives you a lot of tools for debugging your application, real-world scenarios may be somewhat trickier and require a more advanced approach.
In this article, we will learn how to locate code that causes a UI freeze without much prior knowledge of the project and fix faulty code on the fly.
The problem
If you want to follow along, start by cloning this repository: https://github.com/flounder4130/debugger-example
Suppose you have a complex application that hangs when you perform some action. You know how to reproduce the bug, but the difficulty is that you don’t know which part of the code is in charge of this functionality.

In our example app, the hanging happens when you click Button N. However, it is not so easy to find the code that is responsible for this action:

Let’s see how we can use the debugger to find it.
Method breakpoints
The advantage of method breakpoints over line breakpoints is that they can be used on entire hierarchies of classes. How is this useful in our case?
If you look at the example project, you’ll see that all action classes are derived from the Action interface with a single method: perform().

Setting a method breakpoint in this interface method will suspend the application whenever one of the derived methods is called. To set a method breakpoint, click the line that declares the method.
Start the debugger session and click Button N. The application gets suspended in ActionImpl14. Now we know where the code corresponding to this button is located.

Though in this article we are focused on finding the bug, this technique can also save you a lot of time when you want to understand how something works in a large codebase.
Pause application
The approach with method breakpoints works well, but it is based on the assumption that we know something about the parent interface. What if this assumption is wrong, or we cannot use this approach for some other reason?
Well, we can even do it without breakpoints. Click Button N, and while the application is hanging, go to IntelliJ IDEA. From the main menu, select Run | Debugging Actions | Pause Program.
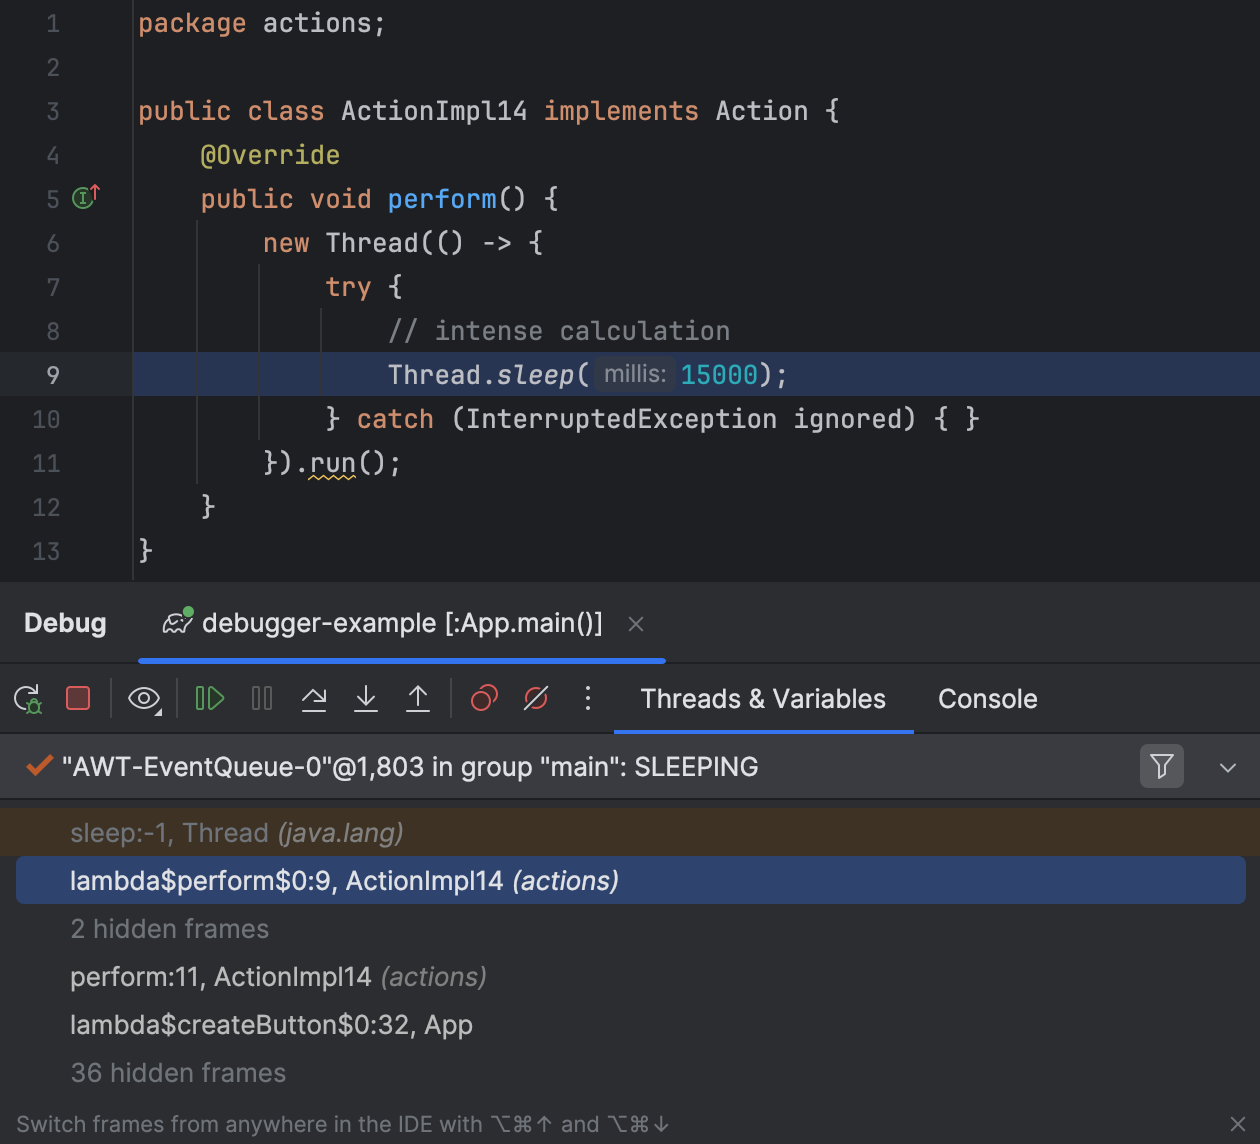
The application will be suspended, letting us examine the current state of the threads in the Threads & Variables tab. This gives us an understanding of what the application is doing at the moment. Since it is hanging, we can identify the hanging method and trace back to the call site.
This approach has some advantages over a more traditional thread dump, which we’ll cover shortly. For example, it gives you information about variables in a convenient form and allows you to control the further execution of the program.
Thread dumps
Finally, we can use a thread dump, which is not strictly a debugger feature. It is available regardless of whether you are using the debugger.
Click Button N. While the application is hanging, go to IntelliJ IDEA. From the main menu, select Run | Debugging Actions | Get Thread Dump.
Scan through the available threads on the left, and in AWT-EventQueue you’ll see what is causing the problem.
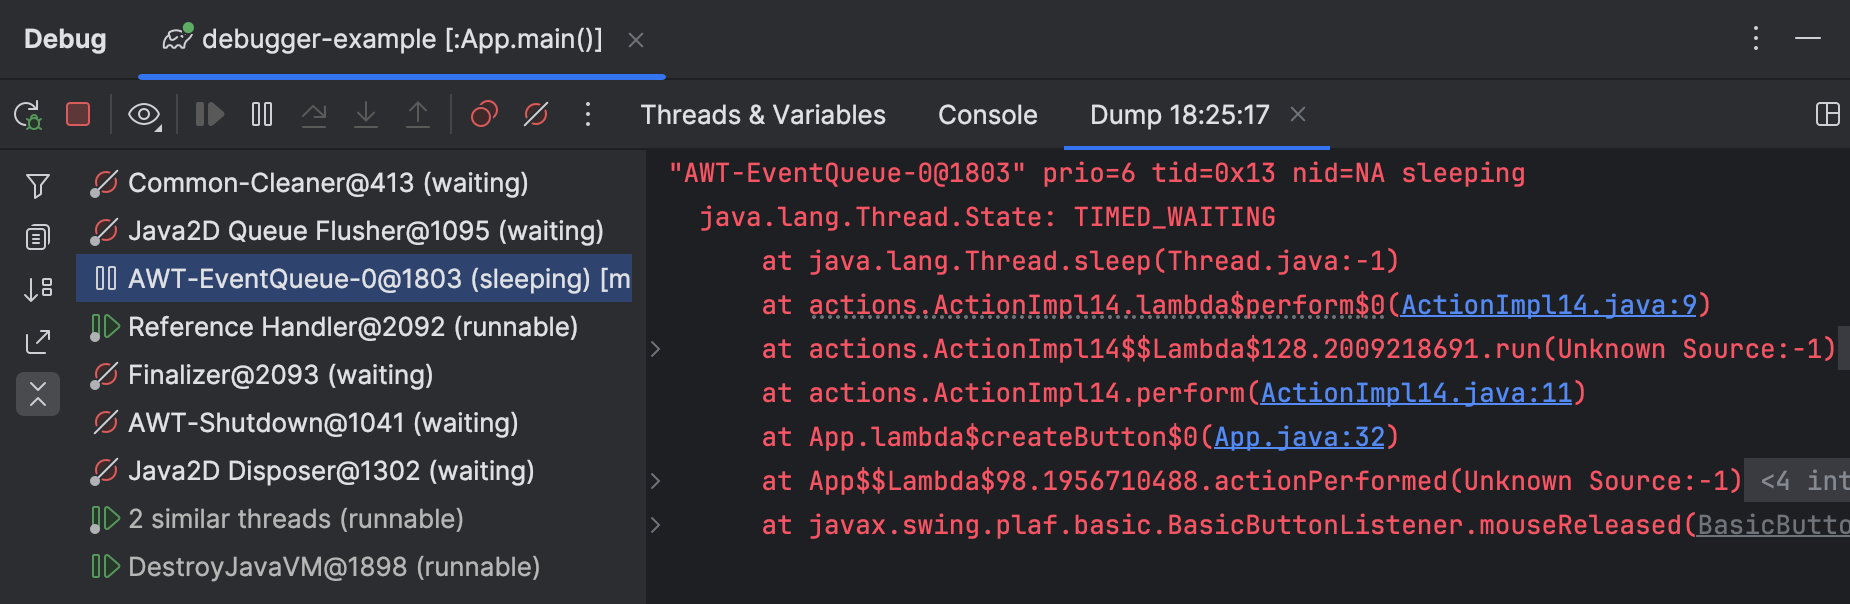
The downside of thread dumps is that they only provide a snapshot of the program state at the time when they were made. You can’t use thread dumps to explore variables or control the program’s execution.
In our example, we don’t need to resort to a thread dump. However, I still wanted to mention this technique as it may be useful in other cases, like when you are trying to debug an application that has been launched without the debug agent.
Understanding the issue
Regardless of the debugging technique, we arrive at ActionImpl14. In this class, someone intended to perform the work in a separate thread, but confused Thread.start() with Thread.run, which runs the code in the same thread as the calling code.
IntelliJ IDEA’s static analyzer even warns us about this at design time:
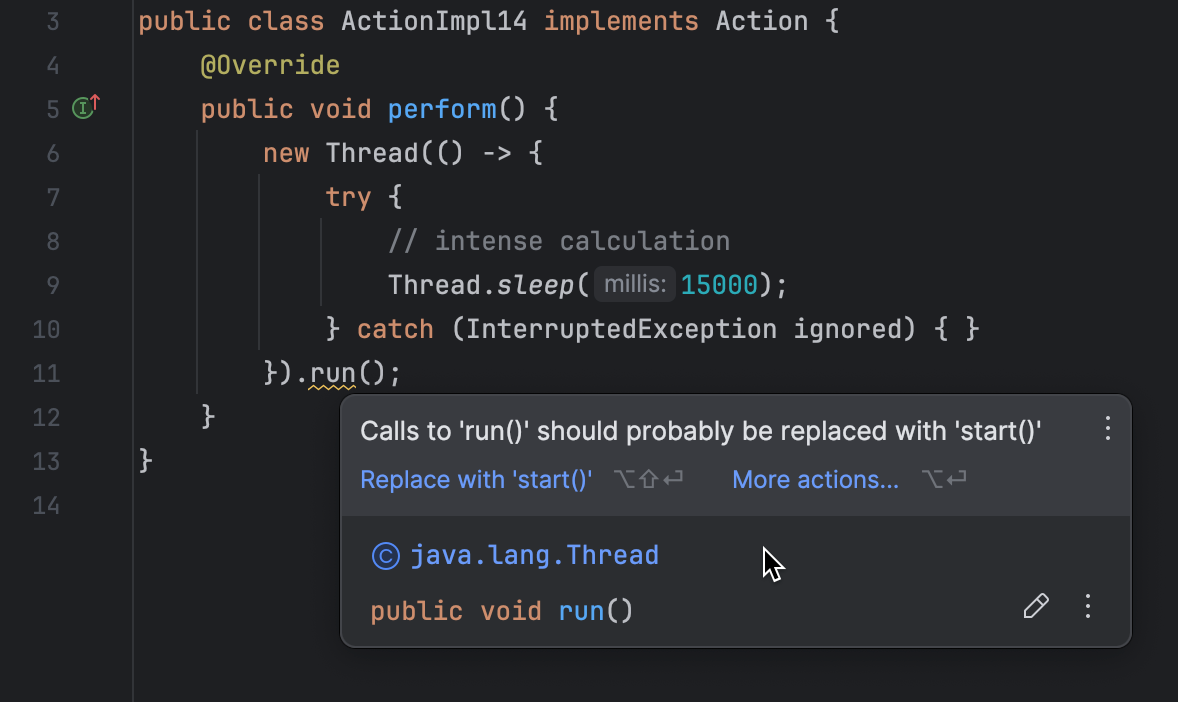
A method that does heavy lifting (or heavy sleeping in this case) is called on the UI thread and blocks it until the method finishes. That’s why we cannot do anything in the UI for some time after we click Button N.
HotSwap
Now that we’ve discovered the cause of the bug, let’s fix the issue.
We could stop the program, recompile the code, and then rerun it. However, it is not always convenient to redeploy the entire application just because of a small change.
Let’s do it the smart way. First, correct the code using the suggested quick-fix:

After the code is good to go, click Run | Debugging Actions | Reload Changed Classes. A balloon appears, confirming that the new code has made its way to the VM.

Let’s go back to the application and check. Clicking Button N no longer hangs the app.
Tip: Keep in mind that HotSwap has its limitations. If you are interested in extended HotSwap capabilities, it might be a good idea to take a look at advanced tools like DCEVM or JRebel
Summary
Using our reasoning and a couple of debugger features, we were able to locate the code that was causing a UI freeze in our project. Then, we proceeded to fix the code without wasting any time on recompilation and redeployment, which can be lengthy in real-world projects.
I hope you find the described techniques helpful. Let me know what you think!
To receive updates on the new posts, follow me on X or subscribe to the mailing list on my blog.
Stay tuned for more!